
ServEye
Server & Website Monitoring
The Challenge
Running dozens of client websites across several servers meant problems were often silent: an app that didn't come back after a reboot, a disk filling up, a certificate about to expire. Without one place watching all of it, the first alert was usually a client noticing their site was down.
The Solution
I designed and built the dashboard and a lightweight server agent. Adding a server takes one command: the agent installs as a system service, auto-detects services like nginx, MySQL, PostgreSQL, Redis and Docker plus every PM2 app, and reports a heartbeat. ServEye catches servers going offline, reboots (with how long the server was unreachable), PM2 apps that stop or never come back, stopped services, and disks or memory nearing their limits. Websites are checked on a schedule for status, response time and required page content, SSL certificates are checked for expiry, and every problem and recovery is emailed with its total downtime. Uptime for 24 hours, 7 days and 30 days, resource charts and a full incident history are kept for every server and site.
Technical Architecture
Next.js 16 App Router with React 19 and TypeScript, PostgreSQL via Drizzle ORM, jose-signed sessions with Argon2id hashing, Zod validation, SWR for live updates, Recharts for the performance charts and Nodemailer for alerts. A zero-dependency Node.js agent runs on each server as a systemd service, and the dashboard runs self-hosted behind nginx with HTTPS.
Key Tech Stack
Business Outcome
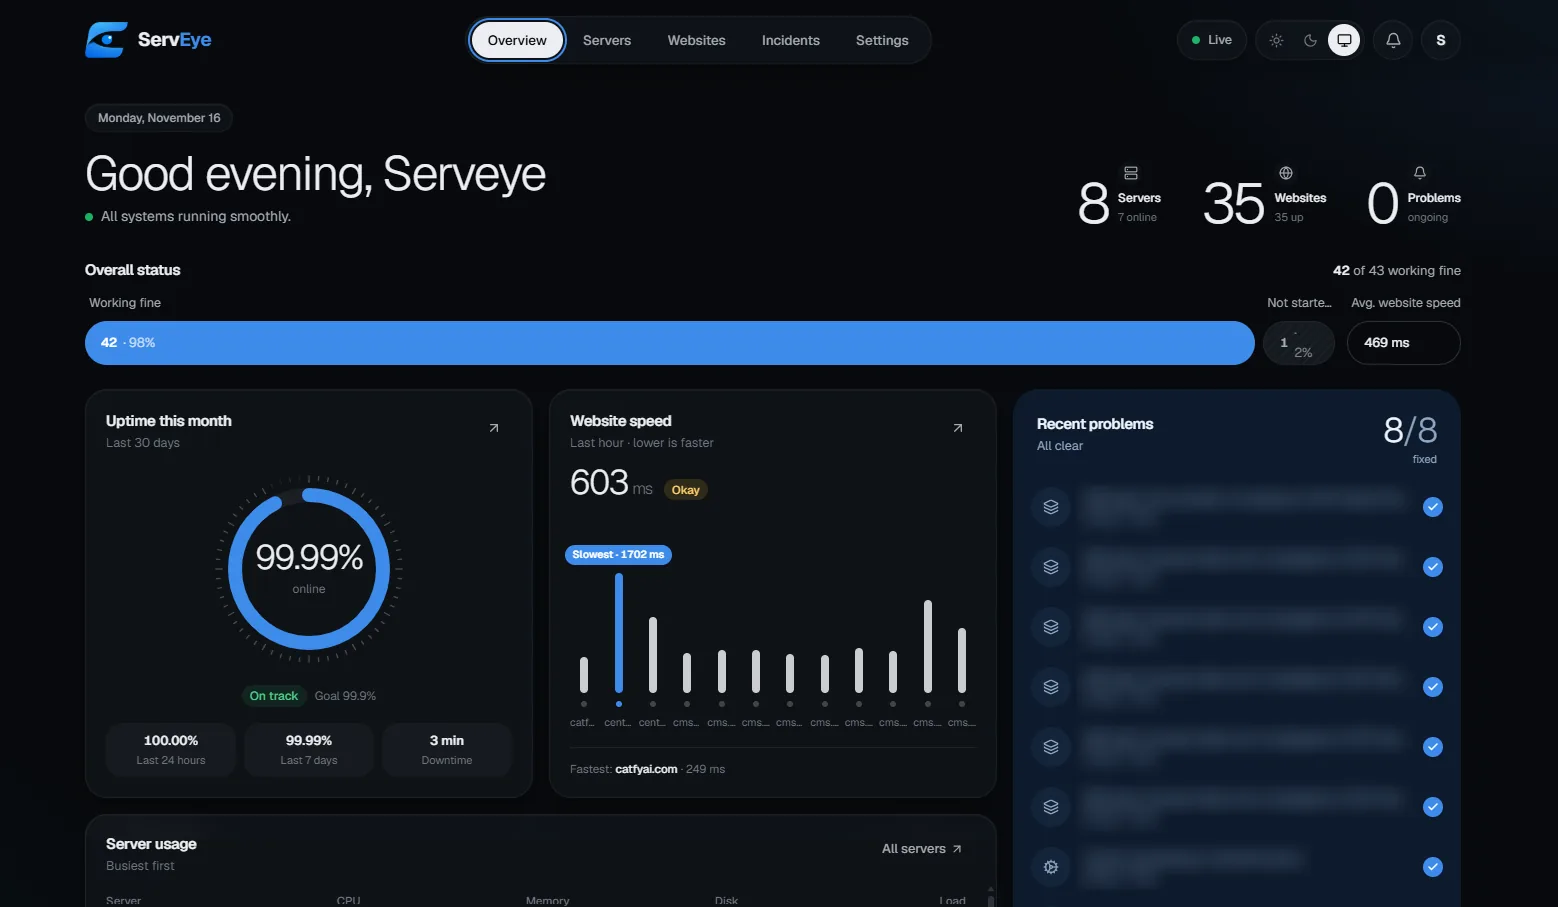
In production as the team's monitoring system, watching 8 servers and 35 websites from one dashboard.
Interface & Dashboard Details
Tap a screen to see it full size.
UX & Design Decisions
- The overview answers one question first, "Is everything OK?", with a greeting, a single status bar and three big numbers for servers, websites and open problems.
- Plain-language labels like "Working fine", "Online time" and "Restarts: Never", so anyone on the team can read server health without ops jargon.
- Problems stay listed until they are fixed and are then struck through, so the team sees both what broke and that it was handled.
- Security built in from the start: Argon2id passwords, strict session cookies, rate-limited login, CSRF checks, a per-request Content Security Policy, and agent tokens stored only as hashes.