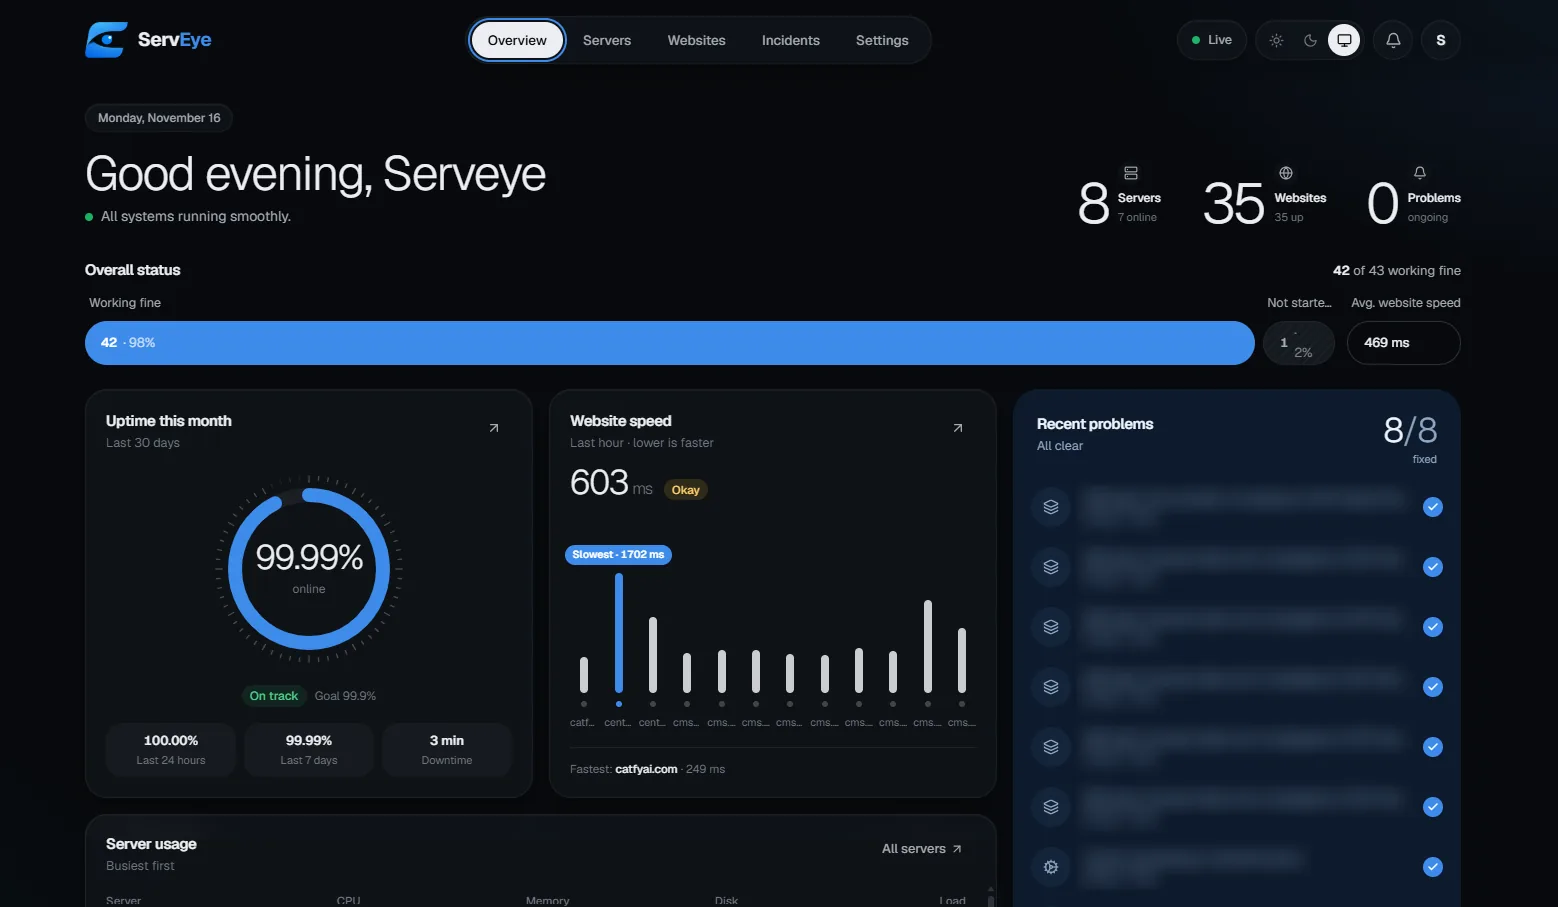
A client website rarely goes down with a bang. A PM2 app quietly fails to start after a reboot, a disk creeps towards 100%, a certificate runs out on a Sunday. ServEye is the self-hosted monitor I designed and built to catch those quiet failures across every server and client site my team runs, and to email us the moment one happens.
The outages nobody notices
We host dozens of client websites and CMS apps across several Linux servers, many of them Node.js apps kept alive by PM2 behind nginx. When something fails loudly, someone notices quickly. The expensive failures are the quiet ones, because the first person to notice is usually the client.
In its first days running, ServEye raised eight problems, and all eight were fixed. None of the ones below is a server falling over. They are the quiet kind:
- PM2 app "client-cms" is missing on Product Server2d ago · Fixed
- PM2 app "client-cms" is stopped on Product Server2d ago · Fixed
- PM2 app "client-cms" is stopped on Product Server2d ago · Fixed
- mysql is activating on Client Server2d ago · Fixed
Failures like these can look fine from the outside for a while: a static front end keeps answering while the CMS behind it is stopped, or a database sits in activating until the next write fails. That gap between “the site responds” and “everything is actually working” is what ServEye exists to close.
Why an uptime checker wasn't enough
External uptime services are good at one thing: requesting a URL and reporting whether it answered. That is half the picture. They can't see a PM2 process that crashed behind a cached page, a disk at 95%, a reboot at 3am that some apps never recovered from, or a stopped nginx on a server whose traffic is routed somewhere else.
To see those you need eyes inside the server. So ServEye is two parts: a tiny agent that runs on every server and reports what it sees, and a dashboard that checks websites from the outside, decides what counts as a problem, and tells people.
How it fits together
Every 30 seconds each agent posts a heartbeat: CPU, memory, disks, load, network, every PM2 app, the systemd services it watches, and request counts from nginx or Apache access logs. The dashboard stores it, compares it with the last one, and opens or resolves incidents.
Zero-dependency Node.js, runs as a systemd service. Reads /proc, PM2 and systemd.
Next.js 16 and PostgreSQL. Stores metrics, checks websites, decides what counts as an incident.
One email when something breaks, another when it recovers, with the total downtime.
Websites are checked from the dashboard itself: status code, optional required text, response time, and the SSL certificate's expiry date.
The dashboard is a single Next.js 16 app on PostgreSQL with Drizzle ORM. There is no separate worker process: the monitoring loops start from Next.js's instrumentation.ts hook when the server boots. Three loops do the work: offline detection every 15 seconds, website checks every 5 seconds for whichever sites are due (up to 20 in parallel), and an hourly cleanup of old metrics.
Running loops inside a web app raises one obvious question: what if two instances start? Postgres answers it. Only the instance holding an advisory lock runs the monitors, and if that connection drops, another instance takes over.
// Only the instance holding this Postgres advisory lock runs monitors.const { rows } = await client.query( "select pg_try_advisory_lock($1) as ok", [LOCK_ID]);if (!rows[0]?.ok) { client.release(); setTimeout(acquireLeadership, 60_000); // someone else leads; try again later return;}startLoops(); // offline checks every 15s, website checks every 5s, prune hourlyAn agent that costs almost nothing
The agent is the part that runs on production servers, so it had one rule: it must never be the thing that causes a problem. It is a single Node.js file with zero dependencies, using only Node's built-in modules, so there is nothing to npm install on a production box. Adding a server is one command:
$ curl -fsSL https://monitor.yourcompany.com/agent/install | sudo bash -s -- --token se_xxxxx
It reads most of what it needs straight from Linux: boot time from /proc/stat, CPU and memory per process from /proc/<pid>, service state from systemctl is-active. The one expensive call is PM2's own CLI, so the agent avoids it unless something has actually changed.
// Starting the PM2 CLI ("pm2 jlist") costs ~0.2-0.3s of CPU, so it only runs when// something changed (an app stopped, restarted or was added) or every 5 minutes.// In between, liveness, CPU and memory come straight from /proc (microseconds)./** Fingerprint of PM2's pid files and whether each process is alive. */function pidFingerprint(pm2Home) { const dir = path.join(pm2Home, "pids"); return fs.readdirSync(dir) .filter((f) => f.endsWith(".pid")) .sort() .map((f) => { const pid = Number(readFile(path.join(dir, f)).trim()); return `${f}=${pid}:${alive(pid) ? 1 : 0}`; }) .join("|");}Knowing what “broken” means
Most of the value is in the rules: what the dashboard treats as a problem, and when.
Reboots needed the most care. The agent sends the kernel's boot time with every heartbeat. If it moves by more than two minutes, the server rebooted, and ServEye says so, with the previous uptime. Then it waits: apps and services get a three-minute grace period to come back before anything is reported as down. Alert straight away and every planned restart becomes a flood of false alarms.
Alerts the team can trust
An alert is only useful if people still read it after a month. Three decisions keep ServEye's emails worth opening:
- Websites alert only after several failures in a row, so a single slow response or network blip stays quiet.
- Every problem gets a matching recovery email with the total downtime, so nobody has to check whether it fixed itself.
- Each incident is opened once and resolved once, so a server that stays down for an hour sends one email when it goes down and one when it's back, however many checks run in between.
The heartbeat endpoint stays fast for the agent, too. It validates and stores the heartbeat, replies straight away, and does the comparison and any email sending afterwards with Next.js's after():
const { prev, watched } = await storeHeartbeat(server, payload);// Reply to the agent now; compare with the last state and send alerts afterwardsafter(() => evaluateHeartbeat(prev, payload, watched));return json({ ok: true, interval: 30 });Built like it will be attacked
A monitoring dashboard knows every server you run, so it is a tempting target. Security wasn't a later pass; it shaped the first version:
- Argon2id password hashing with OWASP parameters, and constant-time login, so unknown emails can't be discovered by timing.
- Signed
HttpOnly,Secure,SameSite=Strictsession cookies that are revoked when a password changes. - Login rate limits per IP and per email, plus nginx limits in front.
- A per-request nonce Content Security Policy,
X-Frame-Options: DENY, HSTS and a CSRF origin check on every write. - Agent tokens are 256-bit, shown once, stored only as a SHA-256 hash, and can be rotated. Heartbeats are size-limited and schema-validated.
- The app listens on
127.0.0.1only, so nginx with HTTPS is the single way in.
Designed for a two-second glance
Monitoring tools tend to show everything at once. I wanted the opposite: open the dashboard and know within two seconds whether anything needs you. The overview leads with one sentence, a single status bar and three numbers: servers, websites and open problems.
The language is plain on purpose. “Working fine”, “Online time”, “Restarts: Never”. Anyone on the team can read a server's health without knowing what a load average is, and the engineers still get the full charts one click deeper.
Where it is now
The first commit landed on 13 November 2026. Three days later ServEye was watching 8 servers and 35 websites in production, and every problem it had raised was fixed. The month's uptime ring reads 99.99%.
A few things I'd carry into any system like this:
- Measure from inside. The most useful signals came from the server itself, not from requesting a URL.
- Make the cheap path the default. Reading /proc costs microseconds; the expensive call runs only when something changed.
- Earn trust with restraint. Grace periods, failure thresholds and recovery emails are what make people keep reading alerts.